Where To Start?The problem of J2ME MIDP fragmentation is well publicised and I don’t intend to bore you by re-hashing the same old complaints. Instead, I want to present an analysis that will assist any developers who wish to create a mass-market application for J2ME MIDP terminals.
Say you want to create a MIDlet that will run on at least half of the MIDP terminals in the world. Where do you start?
You need to know two things:
- What is the Performance (CPU/JVM) of the terminal at the 50th percentile of all MIDP terminals; and,
- What is the minimum heap memory for any terminal with a speed of greater than or equal to the Performance identified in Step 1.
Of course you can turn these questions around the other way.
AnalysisWhereas heap memory for MIDP handsets can be gleaned from manufacturer web sites, performance cannot. For this reason, I will use a MIDP Benchmark result instead.
In this analysis, I use
JBenchmark 2 (JB2) scores as a proxy for performance. I chose JB2 as there is a large database of published results that are freely available and also because over the years I have found it to be a good indicator of overall performance (which is, after all, what we want). In a later post, I intend to examine the various MIDP benchmarks to see whether they measure the same thing.
Unless otherwise stated, the results used in this analysis are drawn from a set of 609 JB2 scores that encompass MIDP 2 handsets released between February 2004 and June 2007 inclusive. Note that I use the JB2 First Test date as a proxy for handset release date in the following analysis. This means that my results are only as good as the folks who tested real handsets.
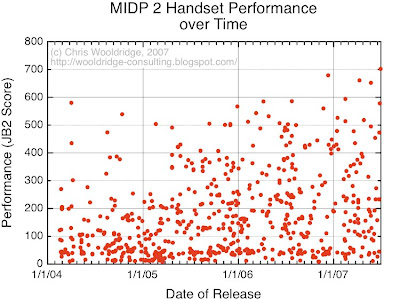
Change in MIDP Performance over TimeThe figure below shows the progression in JB2 scores over time for the 609 MIDP 2 handsets terminals.

Interesting eh? What this shows is that the fastest terminals have become faster; slow terminals are still being released into the market in large numbers; and, that there has been no significant increase in performance at the low end since at least 2004.
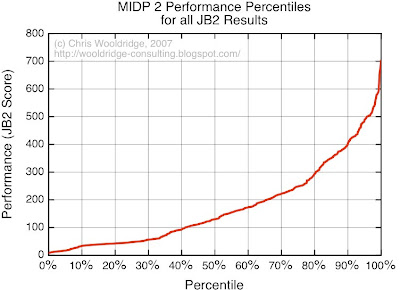
The following figure shows the JB2 score percentiles.

The interesting fact about this graph is again, the low end. Roughly 30% of all MIDP handsets ever released have a JB2 score of less than 50. This is about the speed of the original Motorola RAZR (anyone who has worked with this handset will know that it is very slow indeed). 2007 handsets with a JB2 score of less than 50 include:
- Nokia 2610 and Nokia 6103
- Motorola SLVR L9 and Motorola L2
- LG KG200
- Samsung SGH-Z1oo, Samsung SGH-X160
Some of these are modern, mass market terminals. By the way, Samsung handsets occupy 18 of the bottom 20
handset slots with JB2 scores as low as 8.
Using the figure above, it is possible to answer the question:
If I wish to support 50% of all of the MIDP terminals ever released, what is the minimum performance my application must target?
Using 50% as an example, you can read from the graph that your MIDlet must work on a handset with a JB2 score of 130 or higher. If you wish to target 70%, the JB2 score falls to 57.
Type Model Handsets for Development and TestingGiven that you know your handset performance, you can use the JB2 Scores database to identify a Type Model handset for development and acceptance testing.
Again, using the JB2 score of 130 (50%), your developers could use the following handsets:
- Nokia 8800 (JB2 129)
- Samsung SPH-A800 (JB2 130)
- Motorola i605 (JB2 116)
- Sony Ericsson Z1010 (JB2 130)
- LG F2250 (JB2 117)
Using Type Models like this can eliminate a great deal of development pain as your developers know exactly what they are dealing with and that no terminal of a lesser capability will ever be supported.
You can identify Type Models yourself for a given percentile using the graph above and the
JBechmark results database.
Simplistic?Basing a specification on the results of these figures is rather simplistic of course. This is because the JB2 performance figures represent the entire range of MIDP 2 handsets from 2004 onwards; they do not represent the current state of the market.
That said, it is a starting point from which I will build a more complete picture in the posts that follow. You can expect to see from me:
- Handset memory analysis.
- Performance by handset vendor.
- Weighted analysis by vendor and handset market share (i.e. the the real answer).
Caveat EmptorIn this analysis two major assumptions are made:
- The JBenchmark 2 score is representative of the handset under test's real performance characteristics.
- The subset of MIDP 2 handsets with JBechmark 2 scores is representative of the entire universe of MIDP 2 handsets.
Finally, whereas I have done everything I can to ensure the accuracy of the results presented, there may be errors in the analysis and you should not rely on them without independently checking their veracity.
 This plot reinforces the fact that there has been little change in performance the low end. The bottom 20% of handsets released in 2007 have no better performance than the bottom 20% did in 2004.
