Monday 10 December 2007

Symbian Developer Certificate and SIGNSIS Errors

Symbian Developer Certificate Woes

Yesterday, I generated a new Developer Certificate for a Nokia 6610 handset. This took way longer than it should have done because even though I had successfully generated a Private Key, a Certificate Request and had a Developer Certificate issued by Symbian Signed, I was unable to actually sign a SIS file due to a password error.

The SIGNSIS Error
I ran SIGNSIS with the following command:

SIGNSIS -v -s Test.SIS Test.SISx Test2.cer Test2.key 12345

Where:

  • Test.SIS is the name of my unsigned Symbian installer file;
  • Test.SISx is the name of the signed installer I wanter to create;
  • Test2.cer is the name of my Symbian Developer Certificate;
  • Test2.key is my Private Key; and,
  • 12345 is the password for my Private Key.

This reported the following error:

error:06065064:digital envelope routines:EVP_DecryptFinal:bad decrypterror:0D0680A8:asn1 encoding routines:ASN1_CHECK_TLEN:wrongtagencryption error, Cannot load Test2.key

The salient point being that they key could not be loaded.

The Solution
A number of posts on the net discuss this problem and suggest creating a Private Key without a password. (Clearly this is not recommended practice for anything but a Symbian Developer Certificate that can only be use to sign for a single IMEI.)

If, like me you have not got an ACS Published ID, and you use the Symbian Developer Certificate Request Wizard v2.1, you cannot generate a Private Key without a password. As stated earlier, Keys generated with a password cause an error in SIGNSIS.


Using the wizard you can either select an existing Private Key file or have the tool create a new Private Key for you. However, the Developer Certificate Request Wizard UI is somewhat confusing because on the second property sheet, it has a check box for ‘No Password’ against the Private Key File option. I had assumed that this meant ‘I do not want a password on the generated Private Key’. Not so. What it actually means is ‘There is no password on the Private Key file I have selected’.

What Works
The trick is to create a Private Key using the Symbian makekeys utility. This tool allows you to create a Private Key without a password.

makekeys -cert -dname "CN=Wooldridge OU=Consulting OR=Wooldridge Consulting CO=AU" NoPassword.key ThrowThisAway.cer

Simply answer 'n' to the prompt

Warning: the private key should be encrypted with the -password option

The Private Key file thus generated can then be used with the Symbian Developer Certificate Wizard with the ‘No Password’ option checked. The file ThrowThisAway.cer has no further use.

You must then request a Developer Certificate from Symbian in the normal way. SIGNSIS will now behave.

Tuesday 4 December 2007

Nokia 6610: Packet Data not Allowed

6110 Packet Data Woes
I recently upgraded from a Nokia N70 to a Nokia 6110 Navigator. The process proved remarkably hard due to a 'Packet data not allowed' error whenever I tried to access the Internet.

The Fix
If you have the same problem as I did, the answer is to go to Settings | Phone Settings | Connection | APN Control. If, like me, you see a 'Connection restrictions active' message you have to use the Options | Deactivate restrictions menu item which requires your SIM PIN code.

Call Centre Woes
I have a 3G USIM from Optus in Australia and had no problem accessing packet data services using this SIM card on my N70. My first thought was that the operator settings (APNs) were incorrect on my 6110. So, I:
  • deleted all of the pre-installed used the Settings Wizard; and,
  • used the Settings Wizard to re-create the correct APNs.
No go - same error. I repeated this process using the settings sent OTA from the Nokia Support site. No go - same error again.

Then I tried a friend's USIM in the handset and everything worked fine.

Baffled, I called Optus support and explained the problem. They, in turn, explained that the problem was due a handset problem and forwarded me to the Nokia support call centre. I had a long, but ultimately fruitless, conversation with a nice lady who assured me that the problem was with my APN settings and, once again, made me run the Settings Wizard application. When this failed, she referred me back to Optus support.

I had wasted about one and a half hours at this point.

On my second call to Optus support I was transferred to Technical Support (instead of the normal non Technical Support people who happen to answer the Technical Support number). They immediately came up trumps and had me navigate to the correct menu, enter my PIN and voila.

Two hours wasted - at least 20 minutes on the phone to three separate people at Optus and 10 minutes talking to Nokia.

Rant
I hate APN settings and salute any operator who moves to a single APN.

What really irks me about the waste of time I went through on my new handset is that my Operator already controls what data services I am provisioned for. Why add an additional level of control on the terminal?

Furthermore, why is it that Nokia themselves had no idea even when I had explained that the APN settings worked when my friend's SIM was substituted for my own?

I would guess that the cost of servicing my calls has erased any contribution to Optus' bottom line from my handset this month.

Friday 23 November 2007

Calibration of the Sun Wireless Toolkit - Part II

Background
In my last post, I presented some simple calibration results for the Sun Wireless Tookit against the JBenchmark 2 benchmark test.

In this post, I present extend the previous analysis and post calibration results using varied heap sizes and VM execution speed.

Results
The following plot shows JBenchmark 2 scores derived from the Sun Wireless Toolkit for emulation speeds of 100, 250, 500, 750 and 1,000 bytecodes / second for heap sizes of 500, 1,000 and 2,000 KB.


The trend line for a 1MB heap size coincides with the one that I presented in an earlier post except at 1,000 instructions / second where my machine had a score of 130 versus 120 on Doug's box (the make, model and CPU are different).

Based on this sample of two machines, we can conclude that the WTK VM emulation provides by the WTK will provide similar results across all machines. This is the expected result and it is important because it means that the emulator can be calibrated to perform in a similar way to real handset terminals by setting the VM emulation speed. Furthermore, the emulation speed will will be accurate to within about 10% regardless of the machine specification.

The graph also shows that heap size does not affect the JB2 score. To prove this, I lowered the emulated heap while keeping a constant emulation speed of 1,000 bytecodes/second until the JBenchmark test failed with an out of memory exception. JBenchmark scores varied between 135 and 142 for memory configurations in the range 500 to 100 KB - similar values to those for 1MB in the plot, above.

This result could indicate that either the JBenchmark 2 test creates very little garbage or that the WTK VM speed emulation does not affect garbage collection. I suspect the later is true but need some more benchmark tests that do create lots of garbage in order to test this.

What Next?
I have written an Applet that provides a simple way to visualise handset performance over time by vendor. I just need somewhere to host this which I hope to get around to any day now.

Thursday 23 August 2007

Calibration of the Sun Wireless Toolkit

Background
In my last post, I explained how to calibrate the Sun Wireless Toolkit emulator against a given MIDlet market share.

In this post I show provide simple calibration results from the Sun Wireless Tookit 2.2.

Results
The plot shows how the JBenchmark 2 score changes with VM execution speed for an emulated heap of 1MB.


The first thing to note is that, for an emulated speed of 1000 bytecode instructions/second, the JB2 score is only 120. This means that the toolkit can only provide accurate emulation of approximately 45% of the MIDP 2 terminals on the market today.

Next Steps
The graph, above, needs a whole lot more data points to be useful. The results are taken from a single PCs. It is not clear to me whether results differ on different PCs.

Thanks to Doug Wright at uiActive who actually ran the tests - my PC is still rather sick.

Thursday 16 August 2007

Wireless Toolkit Calibration for Real World Market Share

Applied use of Benchmark Results
From my previous posts here and here, it is possible to use a database of MIDP benchmark results to examine how market share varies according to the MIDlet heap memory and performance requirements.

In this post, I explain how to apply this information in order to calibrate the Sun Wireless Tookit against a particular handset market share.

What Problem Are We Solving?

In my experience, developers spend most of their time on a desktop environment, using an IDE like Eclipse with the Eclipse ME plugin to create and debug a MIDlet. Once the basic development and testing is complete, the MIDlet is transferred to a handset for testing.

Issues arise because of the gulf between the emulator performance and real world handset performance. Calibrating the emulator so that it performs in a similar way to the target handset can help to identify and eliminate performance related problems earlier in the development cycle. Simply put, developers become aware of problems during the development stage, rather than at a later test phase.

Sun Wireless Toolkit Support
The Sun Wireless Toolkit provides all of the tools required to adjust the emulator performance. The user can change:
  1. VM speed emulation;
  2. graphics latency,
  3. network throughput; and,
  4. heap size.


Heap is simple enough. However, for performance, there is no simple mapping between the number of bytecodes/millisecond and real world handset performance. Until now, that is.

Calibration How To
Calibration of the emulator is achieved as follows:
  1. Download the JBenchmark 2 MIDlet JAD and JAR files from here; or, point your emulator at http://wap.jbenchmark.com/JBenchmark2.jad.
  2. Decide the MIDlet market share you require.
  3. Determine a heap memory and JB2 score (perhaps using the estimation tools I provided here).
  4. Set the heap memory using the Wireless toolkit.
  5. Check the 'Enable VM Speed Emulation' box.
  6. Set the slider to 500.
  7. Run the JB2 MIDlet.
  8. Watch Mona Lisa, the little jumping guy, the animated 3D knight, and those those MIDP forms that nobody uses.
  9. When the benchmark finishes look at the JB2 score.
  10. If your KB2 score is greater than your required score, set your emulator slider to 250, if less than your required score, set it to 750.
  11. Run the MIDlet again and repeat using a binary chop until you have an emulation speed that matches your market share.
The following screenshots are from my N70 showing the start and results page.


Before anyone asks, I used my N70 because my PC CPU fan just parted company with the CPU to which it should be bonded. As a result, I'm using the home MacBook to write this article and I can't actually get the screenshots from the emulator.

What Can Go Wrong?
The Sun Wireless Toolkit only enables VM emulation in the range 100-1000. This range is somewhat arbitrary and seems to have no grounding in real world handset performance. Thus, you may well find that the 1000 mark is too slow for your target handset JB2 score.

Next Steps
Once I get that CPU re-attached, and assuming there is no other long-term damage to my PC, I will update this post with some real mappings between JB2 and emulator bytecode/second scores. I'll then try and get someone else to do the same thing in the hope that there is a simple, globally applicable relationship between JB2 score and emulator settings (wouldn't that be nice!)

I keep saying that I am going to post market share results based on handset brand, and I will.
What I want to do is embed an applet in this blog so readers can select any handset brand etc and generate their own chart. I just have to read how to embed an applet in a blog page...

Saturday 11 August 2007

Visualising MIDP Performance Change

Background
Previously, I posted a density plot that demonstrates how MIDlet market share changes as a function of handset heap memory and performance (as measured by the JBenchmark 2 score).

In this post I provide a visualisation showing how market share has changed over time.

Visualisation
The video, below, shows how performance is improving over time.


The video shows how application market share is affected by heap and performance. Each frame is based on one year's worth of data, up to, and including the month shown. For this reason, there is a large amount of noise in the early frames as there were very few MIDP 2 handsets in 2004.

To obtain a very large market share (90+%) of handsets released in 2007, you have to target pretty much the same performance criteria as you did in 2004. In the mid range, handset performance can be seen to be steadily improving.

What Next?
Next, I will run the numbers for Nokia, Motorola, Samsung and Sony Ericsson handsets.

Thursday 9 August 2007

The MIDP Market Share-o-Matic Estimator

Where Were We?
Previously, I looked at MIDP 2 performance and heap memory and provided tools to estimate market share based off either of these measures. I also pointed out problems with any market share estimate based on just one of these measures.

In this post, I provide market share estimates based on both heap and performance criteria.

The Definitive MIDP 2 Market Share Estimator
And here it is...

Using the graph is simple. The X axis gives the heap memory (in this plot, I only show heap to 2.5 MB as it is below this figure where the rate in change in market share is greatest). The Y axis gives the JBenchmark 2 score (a measure of handset performance). The Z axis gives the market share percentile. Percentiles contour lines are plotted for convenience with the contour labels visible to the right of of the Y axis. The small grey dots on the graph show the data points from which the surface was interpolated.

Using the plot you can:

  • Determine the addressable market for an existing application;
  • Provide specifications for a MIDlet based on a required market share; or,
  • Marvel at just how low the specifications are for a MIDlet that is really mass market.
Notable Features
This graph brings into sharp contrast just how important coding for speed and memory efficiency is in the MIDP world if you really want to address a large market share. At the low end, a small increase in MIDlet heap usage causes a significant loss in market share.

The graph is also notable for exactly the opposite reason.

Suppose you agree up front with your developer to live with a target of 768 KB heap and a 100 JB2 score (i.e, you want a market share of 50%). Then, say your developer then tells you that the completed MIDlet actually requires 1MB heap. The graph shows us that this 33% memory overrun will only cost 5% market share. Then, your developer tells you that, ahem, the finished MIDlet only runs on handsets with a JB2 score of 150!

A disaster? Not really. The graph shows us that the combined effect of the 33% memory and 50% performance overrun is a mere 10% reduction in market share.

Another way of saying this is that the rate in change in market share is greatest at low specification handsets. Given what we already know about the bottom 20% of the market (performance and heap), this should not come as a surprise.

Closing Thoughts
This analysis is useful, but needs extending to show similar graphs on a year by year basis. The analysis also needs to be performed for each of the major handset brands. And that is what I hope to provide next time.

Tuesday 7 August 2007

A Trip Down MIDP Memory Lane

Changes in MIDP 2 Memory over Time
In this post, I will examine how heap memory has changed in MIDP 2 devices over time. I will also examine the link between heap memory and handset performance as measured by the JBenchmark 2 benchmark. Finally, I will look at why, as developers, we should be concerned with dynamic heap memory in MIDP terminals.

So We Get More Memory in our Handsets, Right?
The following figure shows the maximum heap memory for 609 MIDP 2 terminals with JBenchmark 2 scores over the period January 2004 through July 2007. Note that the memory axis has a log scale in the range 100 KB through 150,000 KB.
As with the performance plots I presented in an earlier post, this graph goes some way to dispelling the myth that all terminals have more memory in 2007 than they did in 2004. In fact, a large number of terminals are still being released into the market with a maximum heap of less than 1 MB. Indeed, it is astonishing that at least two 2007 vintage terminals report as little as 180 KB heap.

MIDP 2 Heap Memory Percentiles
Once again, from a developer perspective, heap memory percentiles are far more valuable than a scatter plot.
Again, our project manager can use this graph to provide his developer team with a handset terminal matching a required market share for the MIDlet under development. For example, there may be a requirement that the MIDlet address 60% of the MIDP 2 handsets released to July 2007, giving the developers 1 MB of heap at a minimum.

Indeed, a manager might extend this to provide a performance specification based on the JB2 percentile plots I presented previously (the JB2 target for a 60% market share is approximately 100).

Unfortunately, life is not that easy...

The Relationship between Performance and Heap Memory in MIDP Terminals
Our project manager, above, is assuming that performance and memory are ranked equally on MIDP 2 terminals.

The plot, below, shows that (unfortunately) there is no relationship between heap memory and performance as measured by the JBenchmark 2 score.
Rather annoyingly, what this says is if a you choose a 60% market share based off heap memory percentiles, your developers can salivate over a nice juicy 1 MB heap, but they then find that they must target a JB2 score of 38!

Unfortunately, things get even worse.

Dynamic Heap in MIDP 2
Many MIDP 2 terminals implement a memory sharing arrangement called dynamic or adaptive heap. This is where the heap is used for other applications as well as the JVM. What it means for a developer is that a clean handset that is used solely for test and development, may have a heap memory that is not representative of the same handset in the field.

The good news is that the folks at JBenchmark record the minimum and maximum heap seen from a handset under test, and these are from a variety of terminals 'in the wild'. Thus, the range in JBenchmark heap reports is likely to be a good indicator of real world terminal conditions. Maximum and minimum heap from 609 JBenchmark 2 results are shown, below.

Of the 609 handsets used in this study, 252 JBenchmark results (41%) show a difference between the high and low heap memory reported by a handset under test. So, as a developer, if you target a handset with 1 MB heap, and your MIDlet is optimised so that it uses every last byte of this space, you can expect no less than 40% of your terminal market to fail in the field as other applications eat into the precious heap via their shared memory architecture.

In some cases, the heap delta is very significant (the plotted point falls well below the 1:1 line). Of course, this will only be an issue when working with lower end terminals; losing 2 MB of a terminal with a maximum of 8 MB is likely to be far less important to the success of a MIDlet than losing 200 KB from a terminal with maximum of 1 MB heap. Dynamic heap is then an issue developers should be concerned about.

Where to From Here?
In my next post I will finally answer some questions concerning market share by presenting a density plot showing the market share than can be expected from a heap / performance pair.

Monday 6 August 2007

MIDP 2 Performance Frequency Distribution

Background
Previously, I looked at performance percentiles for MIDP 2 handsets over time and said I would provide an analysis of performance by handset vendor. Instead, I will stay at a higher level and look at some more descriptive statistics regarding MIDP 2 performance (JB2 scores) instead over the period January 2004 through July 2007.

The Analysis
The figure below shows the frequency distribution and cumulative frequency distribution of 609 handset JB2 scores.

The cumulative frequency curve approximates the percentile plot I presented in a prior post.

The distribution of JB2 scores has a strong negative skew1 = 1.07795). That is, more data is concentrated in the left tail than would be expected in a normally distributed data set. The distribution is also 'peaky' with kurtosis2 = 0.43981). This tells us that, as developers, we should be looking at the median rather than the arithmetic mean when making a decision regarding market share for our MIDlet.

In the JB2 data set, the arithmetic mean of 173.15 JB2 score is significantly greater than the median of 130. If we had naively targeted a score of 173 and expected a 50% market share, we would actually achieve a market share of approximately 35%. (Bear in mind also that the original Motorola RAZR has a JB2 score of only 49.)

Ranking of Release Date and Performance
In order to better visualise just how poor the relationship between release date and MIDP 2 performance is, the rank of the handset release date is plotted against the rank of the corresponding JB2 score. Ranks are normalised in the range 0 through 1.

This plot is another simple way of showing that there is no relationship between handset performance as measured by the JB2 benchmark and release date. The data set has a Kendall tau rank correlation coefficient of τ = 0.196 indicating a poor correlation.

Summary
What this and my previous posts tell us is that as developers we cannot build our mobile application with an expectation that handset performance is doubling every year. If we assume that the 609 handsets with a JBenchmark 2 score that were used in this analysis are representative of the entire population of MIDP 2 terminals, then we must continue to target low performance terminals.

As I said previously, this analysis is simplistic because it does not take into account market share, memory and other considerations. I will publish an analysis of these factors in coming weeks.

Monday 30 July 2007

MIDP Performance over Time

Handset Performance
In my last post, I examined the gross relationship between MIDP performance over time by plotting JBenchmark 2 scores against handset release date as well as plotting percentile scores. The results are interesting for the fact that, at the low end, there has been very little change in performance over the past three and a half years to July 2007.

In this post I delve further into changes in MIDP 2 performance over time.

Performance Percentiles by Year
Performance percentiles are an extremely useful tool through which developers can target a particular handset market share and identify type model handsets for testing. The plot, below, shows performance percentiles by year. It was generated from the same JBenchmark2 data set of 609 handsets from January 2004 through July 2007 as my previous analysis.

This plot reinforces the fact that there has been little change in performance the low end. The bottom 20% of handsets released in 2007 have no better performance than the bottom 20% did in 2004.

Performance in the Mid-Range
Note the flattening of the percentile plots from 2004 - which is close to exponential - to 2007 - which is much closer to a linear relationship. This flattening is good news for developers as it means that mainstream handsets have seen a significant improvement in performance as compared to the top-end terminals.

What this Does Not Say
The information presented thus will enable managers to clearly define a handset market share based on either a percentile, which gives a performance specification, or a handset terminal, which gives a score through which market share can be derived.

The market share derived in such a way will always be biased unless weighted by vendor market share, or rather, market share of particular terminals. Terminal sales numbers are notoriously difficult to obtain for a given market (iPhone aside). However, vendor market share figures are published and will be used in my next post to look at what performance to expect from Nokia, Motorola, Samsung and Sony Ericsson terminals (the top 4 in Australia, where I live).

Thursday 26 July 2007

Targeted Development for Mass Market MIDP

Where To Start?
The problem of J2ME MIDP fragmentation is well publicised and I don’t intend to bore you by re-hashing the same old complaints. Instead, I want to present an analysis that will assist any developers who wish to create a mass-market application for J2ME MIDP terminals.

Say you want to create a MIDlet that will run on at least half of the MIDP terminals in the world. Where do you start?

You need to know two things:
  1. What is the Performance (CPU/JVM) of the terminal at the 50th percentile of all MIDP terminals; and,
  2. What is the minimum heap memory for any terminal with a speed of greater than or equal to the Performance identified in Step 1.
Of course you can turn these questions around the other way.

Analysis
Whereas heap memory for MIDP handsets can be gleaned from manufacturer web sites, performance cannot. For this reason, I will use a MIDP Benchmark result instead.

In this analysis, I use JBenchmark 2 (JB2) scores as a proxy for performance. I chose JB2 as there is a large database of published results that are freely available and also because over the years I have found it to be a good indicator of overall performance (which is, after all, what we want). In a later post, I intend to examine the various MIDP benchmarks to see whether they measure the same thing.

Unless otherwise stated, the results used in this analysis are drawn from a set of 609 JB2 scores that encompass MIDP 2 handsets released between February 2004 and June 2007 inclusive. Note that I use the JB2 First Test date as a proxy for handset release date in the following analysis. This means that my results are only as good as the folks who tested real handsets.

Change in MIDP Performance over Time
The figure below shows the progression in JB2 scores over time for the 609 MIDP 2 handsets terminals.
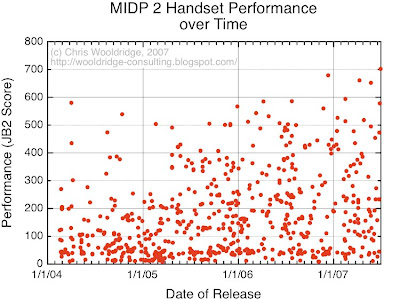
Interesting eh? What this shows is that the fastest terminals have become faster; slow terminals are still being released into the market in large numbers; and, that there has been no significant increase in performance at the low end since at least 2004.

The following figure shows the JB2 score percentiles.

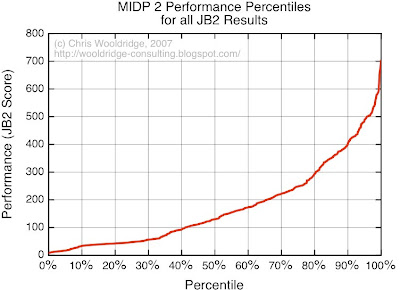
The interesting fact about this graph is again, the low end. Roughly 30% of all MIDP handsets ever released have a JB2 score of less than 50. This is about the speed of the original Motorola RAZR (anyone who has worked with this handset will know that it is very slow indeed). 2007 handsets with a JB2 score of less than 50 include:
  • Nokia 2610 and Nokia 6103
  • Motorola SLVR L9 and Motorola L2
  • LG KG200
  • Samsung SGH-Z1oo, Samsung SGH-X160
Some of these are modern, mass market terminals. By the way, Samsung handsets occupy 18 of the bottom 20 handset slots with JB2 scores as low as 8.

Using the figure above, it is possible to answer the question:
If I wish to support 50% of all of the MIDP terminals ever released, what is the minimum performance my application must target?
Using 50% as an example, you can read from the graph that your MIDlet must work on a handset with a JB2 score of 130 or higher. If you wish to target 70%, the JB2 score falls to 57.

Type Model Handsets for Development and Testing
Given that you know your handset performance, you can use the JB2 Scores database to identify a Type Model handset for development and acceptance testing.

Again, using the JB2 score of 130 (50%), your developers could use the following handsets:
  • Nokia 8800 (JB2 129)
  • Samsung SPH-A800 (JB2 130)
  • Motorola i605 (JB2 116)
  • Sony Ericsson Z1010 (JB2 130)
  • LG F2250 (JB2 117)
Using Type Models like this can eliminate a great deal of development pain as your developers know exactly what they are dealing with and that no terminal of a lesser capability will ever be supported.

You can identify Type Models yourself for a given percentile using the graph above and the JBechmark results database.

Simplistic?
Basing a specification on the results of these figures is rather simplistic of course. This is because the JB2 performance figures represent the entire range of MIDP 2 handsets from 2004 onwards; they do not represent the current state of the market.

That said, it is a starting point from which I will build a more complete picture in the posts that follow. You can expect to see from me:
  • Handset memory analysis.
  • Performance by handset vendor.
  • Weighted analysis by vendor and handset market share (i.e. the the real answer).
Caveat Emptor
In this analysis two major assumptions are made:
  1. The JBenchmark 2 score is representative of the handset under test's real performance characteristics.
  2. The subset of MIDP 2 handsets with JBechmark 2 scores is representative of the entire universe of MIDP 2 handsets.
Finally, whereas I have done everything I can to ensure the accuracy of the results presented, there may be errors in the analysis and you should not rely on them without independently checking their veracity.